本节贡献者: {{何星辰}}、{{田冬冬}}、{{姚家园}}
最近更新日期: 2025-10-21
预计花费时间: 10 分钟
去线性趋势是指计算出一条最能拟合整个波形数据的直线(即趋势线),并从每个数据点中减去该直线对应的值, 使波形围绕稳定的零基线振动。此操作用于去除由温度变化或地壳形变等因素造成的缓慢漂移与基线偏移。
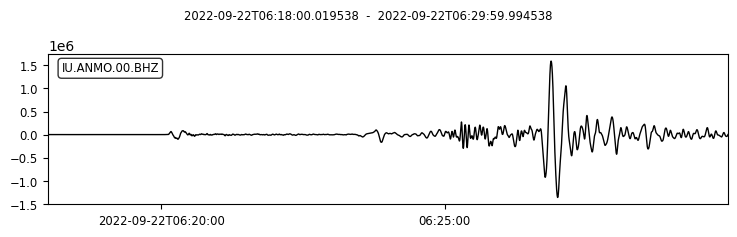
我们以前一节使用的 2022 年 9 月 22 日墨西哥 Mw 6.8 地震在 ANMO 台站的波形为例。
from obspy import UTCDateTime
from obspy.clients.fdsn import Client
import matplotlib.pyplot as plt
from numpy.polynomial import polynomial as P

client = Client("IRIS")

# 下载 2022 年墨西哥 Mw 6.8 级地震在 ANMO 台站的波形数据
starttime = UTCDateTime("2022-09-22T06:18:00")
endtime = starttime + 720  # 下载 12 分钟数据
st = client.get_waveforms(
    network="IU",
    station="ANMO",
    location="00",
    channel="BHZ",
    starttime=starttime,
    endtime=endtime,
)
st.plot();
/home/runner/micromamba/envs/seismo-learn/lib/python3.14/site-packages/obspy/clients/fdsn/client.py:251: ObsPyDeprecationWarning: IRIS is now EarthScope, please consider changing the FDSN client short URL to 'EARTHSCOPE'.
warnings.warn(msg, ObsPyDeprecationWarning)
进行去线性趋势处理之前,通常需要先进行去均值操作。
tr = st[0]

# 去均值
tr.detrend("demean")

# 计算去线性趋势处理前的斜率
slope_before = P.polyfit(tr.times(), tr.data, deg=1)[1]
print(f"Slope before linear detrend: {slope_before}")
Slope before linear detrend: -1.153520875022328
ObsPy 提供了 obspy.core.trace.Trace.detrend 方法可以实现去线性趋势操作。
# 去线性趋势
tr.detrend("linear")

# 计算去线性趋势处理后的斜率
slope_after = P.polyfit(tr.times(), tr.data, deg=1)[1]
print(f"Slope after linear detrend: {slope_after}")
Slope after linear detrend: 1.734000825199208e-14
可以看到,针对去均值后的波形,其斜率从 -1.15 降至 1.96e-14,说明 detrend 方法已成功校正基线。